
OEE Dashboard for Real-Time Manufacturing Performance
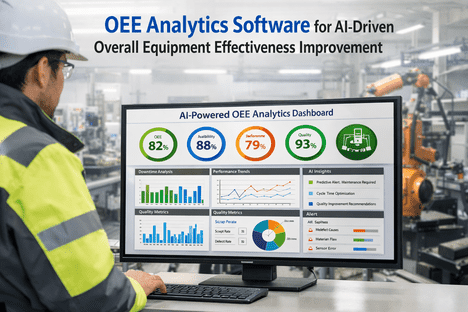
OEE Dashboard: Turning Manufacturing Data into Actionable Production Insights
Modern manufacturing operations generate large volumes of production data every day. Machine status, production quantities, cycle times, downtime events, quality results, shift performance, and equipment utilization all contribute to the overall picture of manufacturing efficiency.
However, collecting this information is only the first step. The real value comes from converting production data into actionable insights that production teams and management can use to improve operations.
An OEE Dashboard provides a centralized way to monitor equipment effectiveness and production performance in real time. Instead of relying on manual production logs, spreadsheets, or delayed reports, manufacturers can bring critical operational information into a single interactive platform.
What Is an OEE Dashboard?
An OEE Dashboard is a manufacturing performance monitoring solution designed around Overall Equipment Effectiveness (OEE).
OEE evaluates equipment performance using three key dimensions:
- Availability – How much of the planned production time the equipment is available for operation.
- Performance – How efficiently the equipment is operating compared with its ideal production speed.
- Quality – How much of the produced output meets quality requirements without defects or rework.
By combining these measurements, an organization can gain a clearer understanding of where production losses are occurring.
The OEE Dashboard described in this project centralizes these measurements together with production output, machine status, downtime information, shift performance, and production trends.
Why Real-Time Manufacturing Monitoring Matters
Traditional production reporting can make it difficult to identify problems while they are happening. If machine downtime or declining production performance is discovered only through an end-of-shift or weekly report, the opportunity to take immediate corrective action may already be lost.
Real-time monitoring changes this approach.
For management, this also creates greater visibility across production lines and shifts, supporting faster and more informed operational decisions.
Identifying the Hidden Causes of Production Loss
A low OEE value does not always tell management exactly why production performance is declining. The underlying causes need to be investigated.
This is where downtime analysis becomes particularly valuable.
The dashboard can categorize downtime events such as:
- Planned maintenance
- Machine breakdowns
- Material shortages
- Operator waiting time
- Tool changes
- Setup activities
- Power failures
- Quality holds
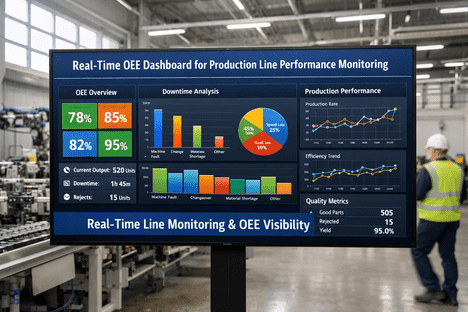
From Production Data to Operational Decisions
A manufacturing dashboard becomes more valuable when it connects individual production metrics into a broader operational picture.
The OEE Dashboard provides analytics around:
- OEE trends
- Production efficiency
- Machine utilization
- Shift-wise performance
- Downtime distribution
- Quality performance
- Production targets versus actual output
- Historical equipment performance
These insights allow production managers to identify trends rather than relying only on individual production events.
For example, repeated performance differences between shifts can highlight opportunities for process optimization or workforce planning. Similarly, recurring downtime categories can help maintenance and production teams focus on specific operational problems.
Comparing Production Performance Across Shifts
Manufacturing performance can vary significantly between production shifts. Without centralized reporting, identifying these differences can require manual comparison of multiple reports.
The OEE Dashboard enables production managers to compare day and night shift performance along with machine productivity, operator efficiency, production volume, quality rate, and downtime per shift.
Automated Manufacturing Reports
Reporting is another area where manufacturing organizations can spend significant time on repetitive manual work.
The dashboard automates the generation of operational reports, including:
- Daily OEE reports
- Weekly production reports
- Monthly equipment performance reports
- Downtime analysis reports
- Shift performance reports
- Machine utilization reports
- Quality performance reports
- Production summary reports
Reports can also be exported in Excel, PDF, and CSV formats for management review and operational use.
Automation reduces dependency on manually compiling production information and gives teams a more consistent reporting process.
Key Benefits of an OEE Dashboard
Implementing a centralized OEE monitoring platform can help manufacturing organizations achieve several operational benefits:
Improved production visibility: Management can monitor important production KPIs from a centralized dashboard.
Faster identification of bottlenecks: Production teams can identify downtime and performance issues without waiting for delayed reports.
Reduced manual reporting: Automated calculations and reports reduce repetitive data compilation.
Better equipment utilization: Machine performance and utilization data help teams identify opportunities to improve equipment productivity.
Improved production planning: Historical and real-time production information can support better resource allocation and planning.
Greater operational transparency: Managers can compare equipment, production lines, and shifts using consistent performance metrics.
The project documentation identifies these outcomes as key benefits of the implemented solution, including real-time monitoring, automated OEE calculation, faster bottleneck identification, improved machine utilization, reduced reporting effort, and better production planning.
Where OEE Dashboards Can Be Used
OEE monitoring can be applied across a wide range of manufacturing environments.
Potential applications include:
- Automotive manufacturing
- Tyre manufacturing
- Industrial equipment manufacturing
- Electronics manufacturing
- FMCG production
- Pharmaceutical manufacturing
- Food and beverage processing
- Metal fabrication
- Packaging
- Smart Factory and Industry 4.0 initiatives
Conclusion
For organizations pursuing smart manufacturing and Industry 4.0 initiatives, real-time OEE monitoring can provide the operational visibility required to make faster, data-driven decisions and continuously improve production performance.